Frencil's Corner
☄
An Initial Look at Cesium ~ 2014-12-01
I spent some of last night playing with Cesium. In a nutshell it's a web-based open-source Google Earth (though I'm sure the developers prefer that Google Earth be known as the proprietary client-installed Cesium). More clearly, it's a JavaScript WebGL platform for creating an interactive model of the planet Earth. And it's cool.
My first challenge was getting WebGL running. WebGL is a fairly new thing and so the open source ATI Drivers for Linux don't support it. In typical Linux fashion, installing the proprietary drivers did not happen cleanly. Immediately after installation the default theme for Mint 16 broke in a variety of ways. Attempting to troubleshoot the problem led me to the dreaded partial dist-upgrade. For a while there I was a thousand miles from home (at the in-laws' for Thnksgiving) and my travel laptop wouldn't even boot to a command prompt. Next time I travel I'm bringing an emergency USB bootable distro of some kind.
It turned out that my x server was locking up and crashing becuase of some deep incompatibility between the still installed proprietary graphics drivers and the partially upgraded OS. Once I found my way back to a command line I went full upgrade to Mint 17, blasted and reinstalled the ATI drivers, and got everything working again.
***
Cesium has clearly been built with developers in mind. This is evidenced, first off, by the extensive documentation and starter tutorials that come packaged in the build. Fairly sure what I wanted to build but unsure of how best to deploy it I started by forking the main repository and following the Contributor's Guide in the wiki.
The build has a lot in it, though, and it's not immediately clear how best to deploy a minimal setup for a standalone project. Take for example the Sandcastle - the included tutorial system. You're presented with a split window that has a JavaScript emulating console on the left, a WebGL display running the Cesium "final product" on the right (the interactive Earth model) and a carousel of example tutorials along the bottom. If nothing else I found this most helpful as a collection of code snippets with quick visual access to what they do - something that greatly facilitated learning the API conventions. The documentation, while extensive, requires a solid understanding of the object-oriented architecture of the platform. Seeing archetypal snippets in action helped primarily to expose the building blocks of the archetecture, but there's still a lot to learn.
At any rate, when my project is ready to go I'll want to deploy it with a minimal footprint, so understanding the structure of the build will be important. A production Cesium app won't need the tutorials, the documentation, or the Sandbox with all its extras like hooks for capturing clicks in the model to highlight lines of JavaScript in the console. But first things first: a working app with a purpose.
***
On August 21, 2017 there will be a total solar eclipse that cuts directly across North America. My excitement for this simply can't be understated. When I was in elementary school the first partial solar eclipse in my region of the world happened and I saw my first crescent sun. Countless lunar eclipses later we were treated to another partial solar eclipse just this past October, so I built a solar filter for my telescope. But I've never seen a total solar eclipse, never observed the sun's corona with my own (protected) eyes.
Eclipses are strange beasts to conceptualize on their full four-dimensional scale. It's a shadow that streaks across the surface of the Earth in a slow, undulating arc. For this eclipse in partiular the swath is wide and stretches from Washington state to South Carolina. I'll be camping, somehwere, but where? There's so much excellent wilderness along the track, and while there are abundant maps available they are all static images with static scale. Cesium, however, is interactive - zoomable, panable, and able to import satellite imagery, road maps, and so much other public data. It's a giant dynamic map. All it needs are details of the event.
Using some coarse NASA waypoint data for the northern/southern limits and central line of the eclipse track I was able to produce this:
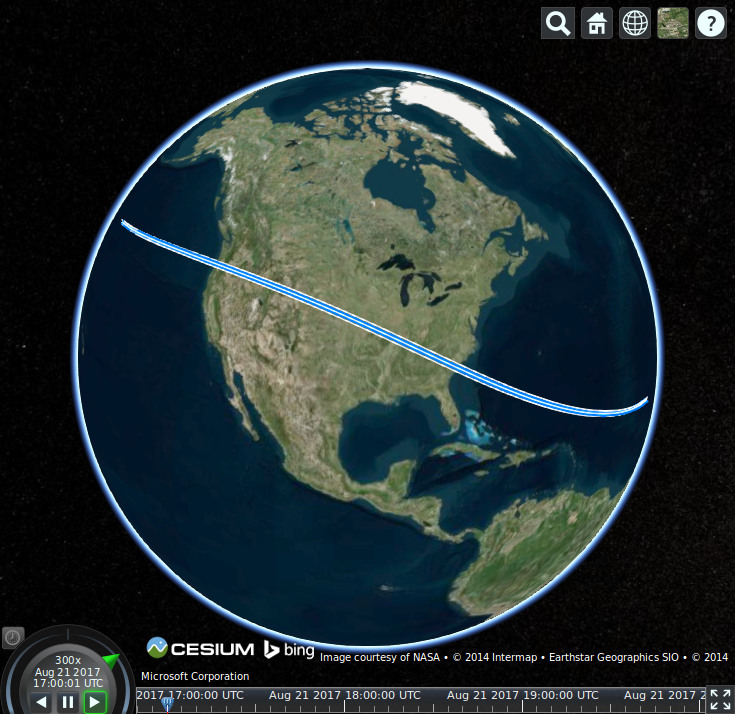
The most satisfying moment, of course, was going from a proof-of-concept for polyline rendering (three points) to the full data set. There was the swath I'd seen in so many static images, landing right where I expected it to be, and now I could navigate along the track at almost any scale I wanted!
The app still needs a lot of work, and it's not deployed anywhere just yet. I suppose I have until the summer of 2017, but it should be up in the next few months all the same. I next plan to convert the main polylines into a more portable and organized CZML document, then begin learning how animations in Cesium work. Cesium has a timeline feature that's quite easy to use, so it was trivial to loop the virtual clock over the time frame of the eclipse on that future August afternoon. The minimum viable product, therefore, is a traveling shadow so any user could dial in their time to see exactly where the moon's shadow falls at any time to any level of detail. Now that's something I want to play with.
Christopher Clark
2014-12-01
Latest Post
Archives
Dossier
github: Frencillinkedin: Frencil
youtube: C. Clark
Résumé